1. OVERVIEW
The parameter adjustment module is relatively straightfor-
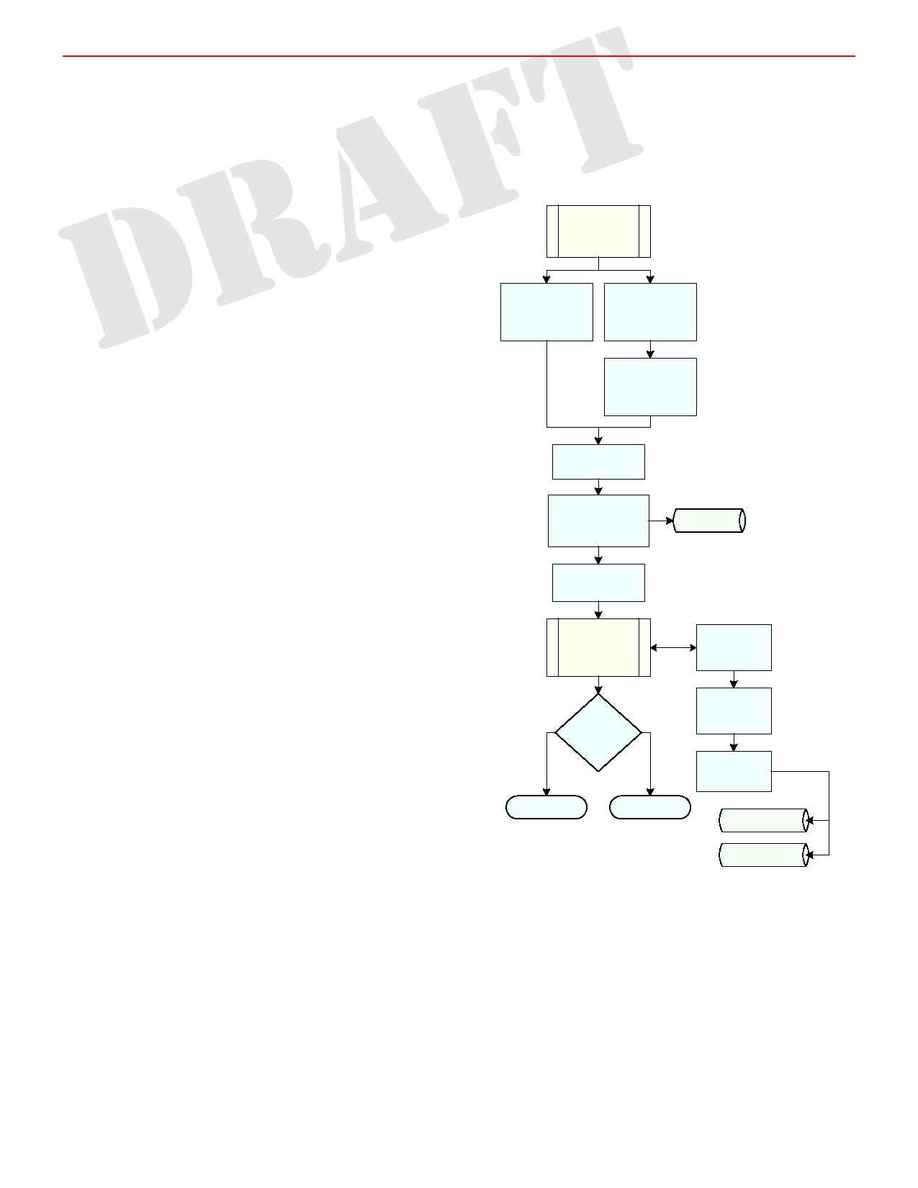
ward. The processed observations from the Observations Mod-
ule and the calculated ephemeris data from the Integration
Module are compared, thus forming the O-C residuals. First,
coordinate frame compatibility between the observations and
the synthetic ephemeris is reconciled. The calculated ephem-
eris must be transformed to apparent positions in order to
match the observations. The residuals are characterized, with
statistical and descriptive output going to disk as well as to an
output window on-screen. At this point, outlying data points
can be automatically -- or manually -- detected and removed.
The core of the module follows with the determination of
parameters via a maximum likelihood estimator. The normal
equations are formed and solved, and the parameters and asso-
ciated formal error estimates are saved. Finally, the residuals
are evaluated, and the module exits with a solution "accept-
ability" code. Figure 7 illustrates the process.
Matrix inversion is accomplished via singular value decom-
position (SVD), which is very robust and offers useful diag-
nostics for ill-conditioned matrices. Singularities are automati-
cally detected and corrected, and the problem parameters are
identified. In essence, if the algorithm encounters an ill-
conditioned matrix, it safely steps around the problem point(s)
and proceeds in such a way as to mine the matrix for the maxi-
mum amount of information. When a singularity (rare in prac-
tice) or degenerate column (not rare!) is encountered, the com-
bination of parameters that led to the fault is easily extracted.
Thus, not only are singularities safely handled, but -- more
importantly -- parameter combinations to which the data are
insensitive are automatically identified.
It is unusual to encounter a computational method that is this
reliable and blowup-proof. I have already developed and tested
matrix inversion using SVD and incorporated it into the Matrix
utility class (Chapter ??). With regard to Newcomb, SVD is a
"plug'n'play" capability.
In the sections that follow, we present the formalism used
for our least squares estimation of the parameters from the re-
duced observational data. Section 2 introduces linear least
squares, mainly in order to develop the formalism, since in
practice we must perform a nonlinear least squares analysis.
Section 3 derives the equations that give the formal parameter
errors from a linear analysis. Section 4 then discusses the non-
linear least squares method that Newcomb uses.
2. LINEAR PARAMETER ESTIMATION
If the observational errors are uncorrelated, then maximum
likelihood estimation becomes a simple linear least squares es-
timation. We cannot, of course, get away with linear least
squares in actual practice, but it is useful to develop the for-
malism first before presenting the nonlinear least squares for-
malism in section 4.
We will assume that the observational errors are uncorre-
lated and normally distributed. More precisely, the data errors
are assumed to have two components: systematic errors and
random errors. We assume the systematic components are
modeled with bias parameters which will be estimated. It is the
random components which we assume to be uncorrelated and
normally distributed. Hence, the probability of a specific data-
set occurring, given a model with physical and bias parame-
n
ters (a vector of length ), is the product of the probabilities of
n
the individual data points:
N
C
HAPTER
3: T
HE
P
ARAMETER
A
DJUSTMENT
M
ODULE
M
ARC
A. M
URISON
Astronomical Applications Department
U.S. Naval Observatory, Washington, DC
C
HAPTER
3: T
HE
P
ARAMETER
A
DJUSTMENT
M
ODULE
8
Figure 7 -- Parameter adjustment module.
Parameter
Adjustment
retrieve
massaged
observations
retrieve
calculated
ephemeris
calculate O-C
quantities
statistical
characterization
of residuals
statistics
form the
normal
equations
solve the
normal
equations
output
parameters
correlations
determine
parameters
evaluate
residuals
exit TRUE
exit FALSE
removal of
outliers
calculate
apparent
positions