GEOGRAPHIC DATA for the July 30, 2001 Issue
Analysis by State/Province
Subscription and single copy sales figures are based on the percentage for each State/Province determined by analysis of the February
12, 2001 issue and these percentages are projected against the total for the July 30, 2001 issue.
7
B
PAID CIRCULATION
STATE
SUBSCRIP-
TIONS
SINGLE
COPY SALES
TOTAL PAID
% OF CIRC.
Maine .............................
15,095
88
15,183
New Hampshire...............
17,432
176
17,608
Vermont...........................
8,442
82
8,524
Massachusetts ................
98,024
1,945
99,969
Rhode Island ...................
13,130
162
13,292
Connecticut .....................
56,845
832
57,677
NEW ENGLAND
208,968
3,285
212,253
6.9
New York .........................
218,243
4,174
222,417
New Jersey .....................
109,034
1,793
110,827
Pennsylvania...................
148,749
2,000
150,749
MIDDLE ATLANTIC
476,026
7,967
483,993
15.8
Ohio.................................
140,350
4,742
145,092
Indiana ............................
71,330
576
71,906
Illinois ..............................
143,075
1,945
145,020
Michigan..........................
116,796
1,436
118,232
Wisconsin........................
78,904
842
79,746
EAST N. CENTRAL
550,455
9,541
559,996
18.3
Minnesota........................
63,460
951
64,411
Iowa.................................
38,950
246
39,196
Missouri...........................
59,009
472
59,481
North Dakota ...................
7,170
45
7,215
South Dakota ..................
9,516
58
9,574
Nebraska.........................
25,557
158
25,715
Kansas ............................
35,758
277
36,035
WEST N. CENTRAL
239,420
2,207
241,627
7.9
Delaware.........................
9,894
188
10,082
Maryland .........................
64,974
1,554
66,528
District of Columbia.........
7,731
346
8,077
Virginia ............................
80,457
1,843
82,300
West Virginia ...................
13,758
134
13,892
North Carolina .................
79,322
939
80,261
South Carolina ................
33,818
365
34,183
Georgia ...........................
71,664
1,174
72,838
Florida .............................
152,268
2,733
155,001
SOUTH ATLANTIC
513,886
9,276
523,162
17.1
Kentucky .........................
33,559
867
34,426
Tennessee .......................
52,318
846
53,164
Alabama ..........................
33,897
488
34,385
Mississippi.......................
17,065
582
17,647
EAST S. CENTRAL
136,839
2,783
139,622
4.6
Arkansas .........................
19,005
140
19,145
Louisiana.........................
32,515
522
33,037
Oklahoma........................
32,273
284
32,557
Texas...............................
171,587
2,604
174,191
WEST S. CENTRAL
255,380
3,550
258,930
8.5
Montana ..........................
10,261
125
10,386
Idaho ...............................
11,454
144
11,598
Wyoming .........................
5,823
61
5,884
Colorado..........................
59,633
953
60,586
New Mexico.....................
14,206
151
14,357
Arizona ............................
50,200
1,179
51,379
Utah.................................
20,343
453
20,796
Nevada ............................
19,133
913
20,046
MOUNTAIN
191,053
3,979
195,032
6.4
Alaska..............................
6,168
174
6,342
Washington......................
62,066
1,193
63,259
Oregon ............................
37,809
613
38,422
California .........................
314,228
6,681
320,909
Hawaii..............................
14,935
431
15,366
PACIFIC
435,206
9,092
444,298
14.5
U.S. Unclassified.............
UNITED STATES
3,007,233
51,680
3,058,913
100.0
U.S. Circ. Percent of
Grand Total..................
96.1
Poss. & Other Areas........
3,974
13
3,987
0.1
U.S. & POSS., etc.
3,011,207
51,693
3,062,900
96.2
CANADA
Newfoundland .................
919
52
971
1.1
Nova Scotia .....................
2,809
131
2,940
3.2
Prince Edward Island ......
559
9
568
0.6
New Brunswick................
1,756
57
1,813
2.0
Quebec............................
5,821
215
6,036
6.7
Ontario.............................
45,758
1,737
47,495
52.4
Manitoba..........................
3,308
114
3,422
3.8
Saskatchewan .................
3,637
115
3,752
4.1
Alberta.............................
9,534
415
9,949
11.0
British Columbia ..............
12,598
736
13,334
14.8
Northwest Territories .......
168
6
174
0.2
Yukon Territory ................
81
7
88
0.1
Canadian Unclassified.....
TOTAL CANADA
86,948
3,594
90,542
100.0
Canadian Circ. Percent
of Grand Total..............
2.8
International.....................
2,808
53
2,861
0.1
Other Unclassified...........
3
6,568
6,571
0.2
Military or Civilian
Personnel Overseas....
20,376
20,376
0.7
GRAND TOTAL
3,121,342
61,908
3,183,250
100.0
PAID CIRCULATION
STATE
SUBSCRIP-
TIONS
SINGLE
COPY SALES
TOTAL PAID
% OF CIRC.
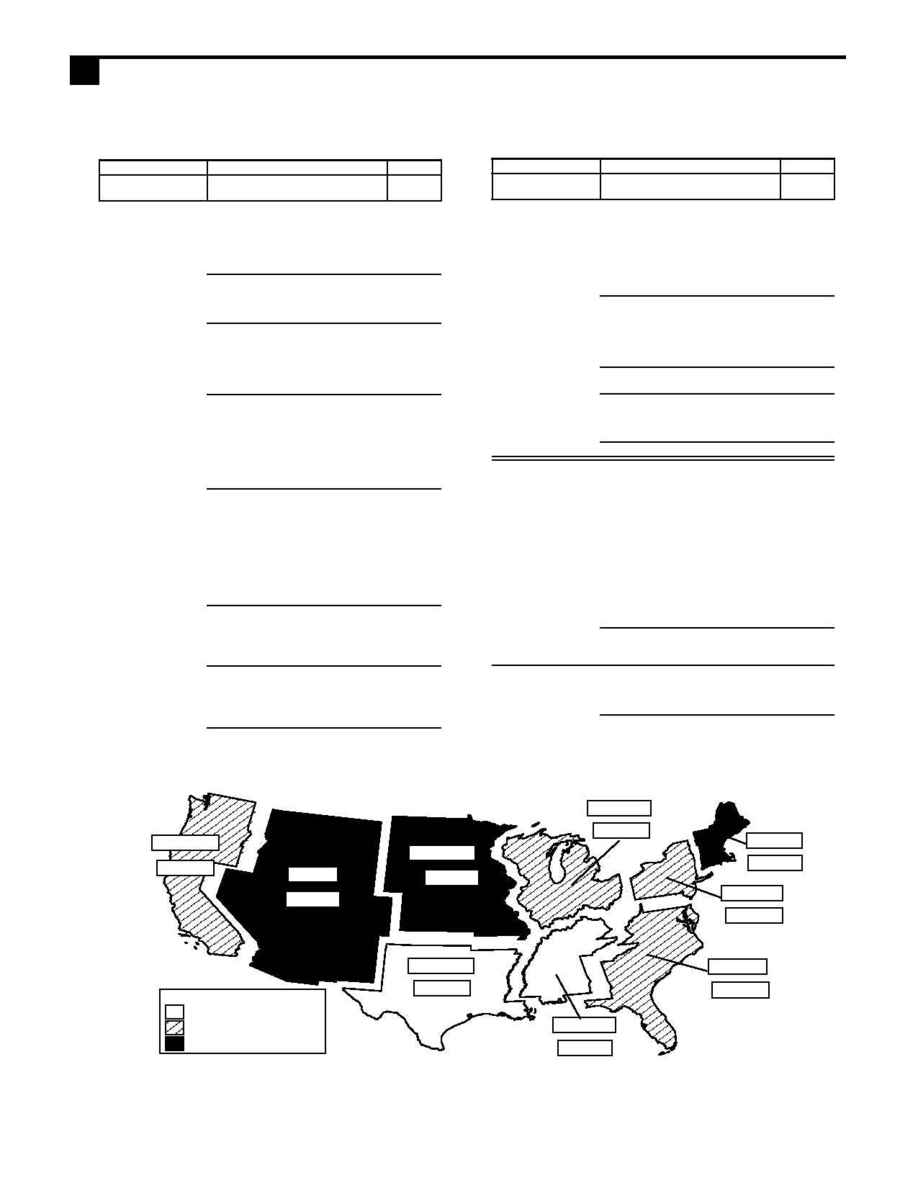
Index = Geographic Distribution of % Circulation ÷ % Population
Page 4 of 6 - Sports Illustrated (04-1155-0)
Copyright © 2002 Audit Bureau of Circulations. All rights reserved.
West N. Central
Index: 111
West S. Central
Index: 79
Pacific (AK& HI)
Index: 92
Mountain
Index: 116
East S. Central
Index: 75
South Atlantic
Index: 98
East N. Central
Index: 108
Middle Atlantic
Index: 105
New England
Index: 130
% Circ: 8.5
% Pop: 10.8
% Circ: 6.4
% Pop: 5.5
% Circ: 14.5
% Pop: 15.7
% Circ: 4.6
% Pop: 6.1
% Circ: 17.1
% Pop: 17.5
% Circ: 18.3
% Pop: 16.9
% Circ: 7.9
% Pop: 7.1
% Circ: 15.8
% Pop: 15.1
% Circ: 6.9
% Pop: 5.3
Legend
Regions with index <= 90
Regions with index between 90 and 110
Regions with index >= 110