23
ENVIRONMENTAL IMPACT
A key initiative during the year to help improve our environmental
performance was the preparation and launch of the City Care
Environmental Plan 2005. The Environmental Plan is a booklet
similar in format to our Health and Safety Plan. The aims of the
plan are to provide a single point of reference for environmental
issues, to raise staff awareness of the key environmental
impact's of the company's operations and to show staff how to
identify environmental hazards associated with the business,
how to minimise environmental harm and how to respond to
environmental emergencies.
City Care has maintained accreditation to ISO 14001 for our
environmental management systems, as have some of our key
competitors. We have chosen to let our Enviromark Diamond
accreditation lapse.
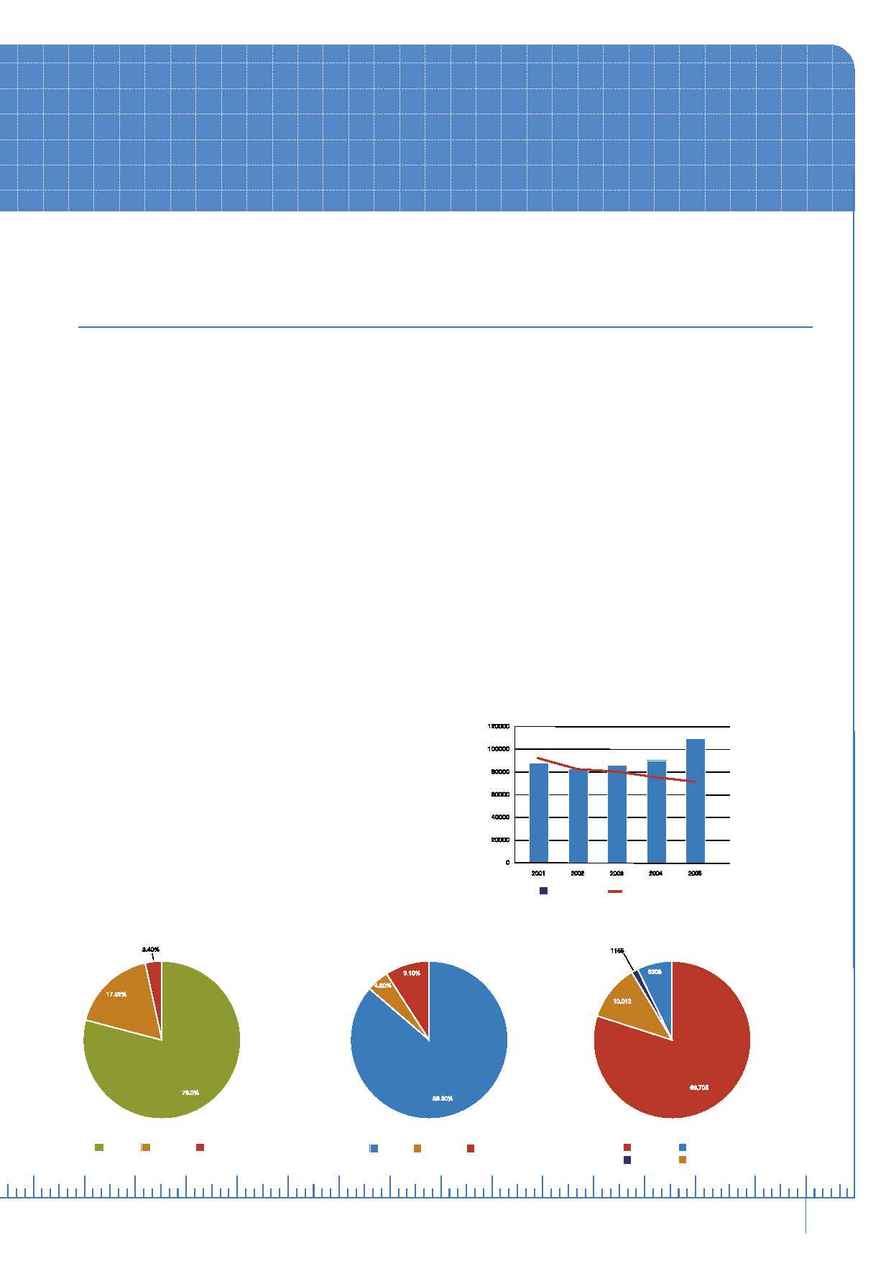
Energy use
Our energy use profile has changed little in the past year. Diesel
continues to be the major source of energy for City Care's fleet
and also to run our asphalt plant.
The company's energy consumption per million dollars of
revenue has declined for the fifth consecutive year. However, the
total energy consumed increased to 109,605 gigajoules (GJ),
from 90,202 GJ the previous year.
Note f
This is equivalent to the
energy used by 2505 households.
Note g
Greenhouse gases
During the year, City Care created 7,128 tonnes of CO
2
emissions through combustion of diesel and petrol. While this
constitutes an increase of over 20% on last year's figure of 5856
tonnes, when considered in relation to the company's growing
revenue, it actually represents an increase in eco-efficiency from
93.5 tonne CO
2
/ $M revenue
to 86.7 tonne CO
2
/ $M revenue.
The CO
2
created by City Care is equivalent to that consumed by
1,295 hectares of native forest.
Note h
Solid waste
City Care produced 87,214 tonnes of waste this year, of which
69,705 tonnes or nearly 80% was clean fill generated from
construction activities. This material is used to rehabilitate
existing quarries.
The amount of clean fill produced by the company was
significantly more than in the previous year. This increase in
construction waste was in large part attributable to the purchase
of Local Construction and the associated rise in roading
construction work undertaken by the company.
ENERGY USAGE
GJ
GJ/$ millions
Total Energy Energy Usage per $1m turnover
ENERGY USAGE BY AREA
ENERGY USAGE BY SOURCE
WASTE PRODUCED (TONNE)
Fleet Asphalt General
Diesel Electricity Petrol
Hardfill
Cover Material
Green
Mixed
2500
2000
1500
1000
500