City Care Performance report 2005 Page 12
Per
centage
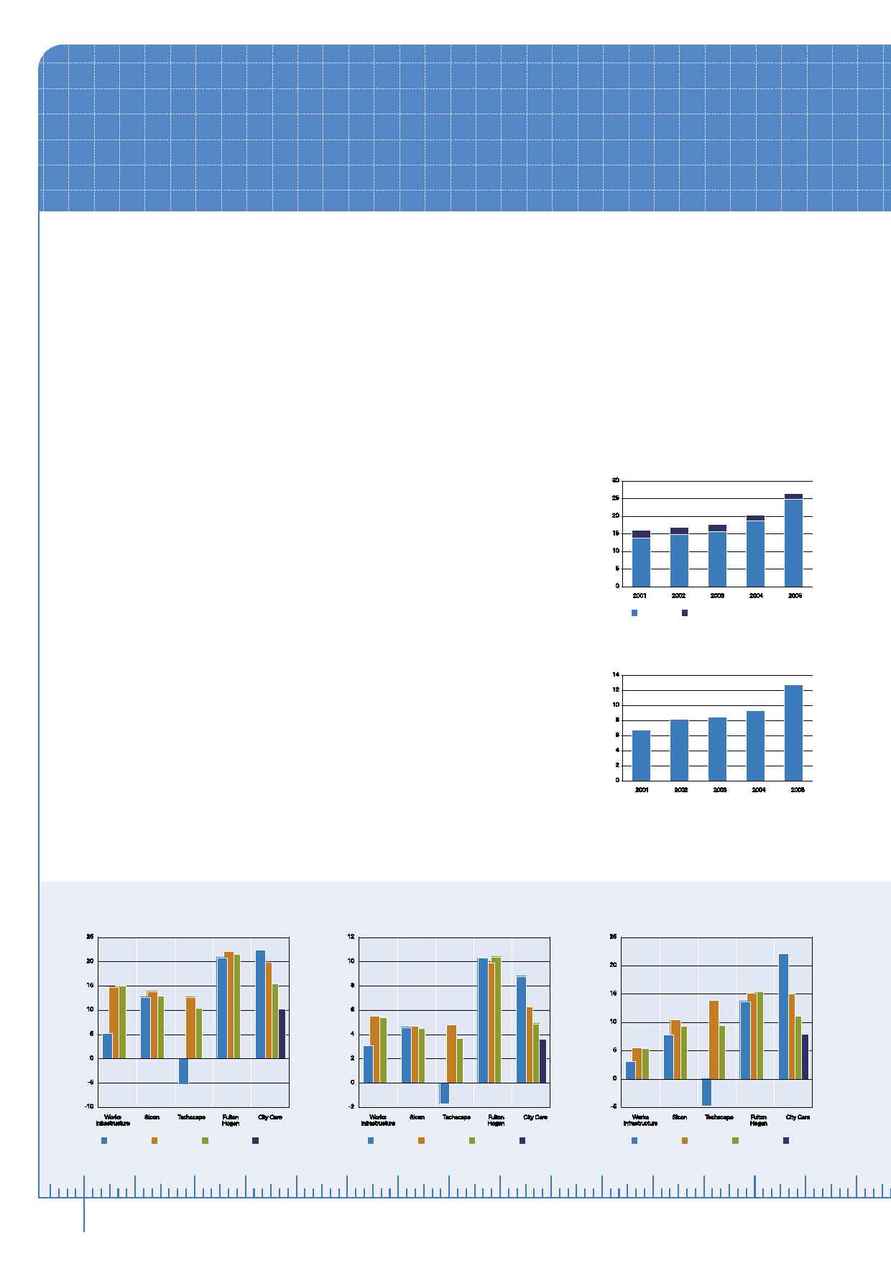
RETURN ON EQUITY
Per
centage
EBIT/REVENUE
Per
centage
EBIT/TOTAL ASSETS
2002
2003
2004
2005
2002
2003
2004
2005
2002
2003
2004
2005
Financial benchmarking
City Care benchmarks its performance against competitors
whenever possible. The graphs below show our relative financial
performance against published and audited data from key
competitors.
Note a
Normalised indicators chosen are return on
equity, EBIT/revenue and EBIT/total assets.
Economic Contribution
In New Zealand terms, City Care is a large employer. At the end
of the year we had over 740 permanent staff, 50 fixed term,
part-time or casual staff, and 40 agency staff on our payroll.
With the inclusion of payments to agencies for temporary staff,
City Care paid $26.5 million in wages to staff this year. This
represents an increase of $6.26 million on the previous year.
A large proportion of this increase can be attributed to the fact
that City Care's staff numbers have grown by over 20% in the
past year.
City Care also paid tax (PAYE, GST, FBT and company) of
$12.72 million (previous year's figure: $9.28 million) to central
government. The company received government subsidies
from Work and Income in the form of support for long-term
unemployed youth employed on our pre-apprentice programme.
Support provided is less than 20% of the cost of this initiative.
TOTAL TAX PAID
(PAYE, GST, COMPANY)
$millions
WAGES PAID
$millions
Direct
Agency
12
Our shareholder CCHL received $0.84 million in dividends from
City Care during the year.
City Care has a policy of paying suppliers within agreed payment
terms. We are not aware of any suppliers that rely on City Care
for the majority of their business, with the exception of two
consultant software developers and an electrical subcontractor
with whom we have close working relationships.